Candlestick Charts & Patterns
Learn how candlestick charts portray price action, explore common patterns and understand why they must be paired with disciplined risk management.
What Is a Candlestick?
A candlestick chart displays the opening, high, low and closing prices of a security for a specific time period. The wide “real body” compares the opening and closing prices, appearing dark if the asset closed lower or light if it closed higher. Thin lines called wicks or shadows extend above and below the body to show the period’s high and low prices. Together, these elements reflect changes in investor sentiment and are used by technical analysts to decide when to enter or exit trades.
Detailed Anatomy of a Candle
Each candlestick tells a story about how price moved during a given interval. The real body illustrates the difference between the open and close. A long body signifies strong buying or selling pressure, whereas a short body suggests indecision or consolidation. The upper wick (or shadow) shows how high buyers managed to push price before sellers pushed it back, while the lower wick shows how far sellers drove price before buyers stepped in. When the close is above the open the body is often coloured light or hollow (bullish); when the close is below the open the body is dark or filled (bearish). Candlesticks can be plotted on any timeframe—from one minute to one month—so context matters: a bullish candle on a one‑minute chart may be noise inside a bearish daily trend.
Why Traders Use Candlestick Charts
Candlestick charts convey a large amount of price information in a compact form. Patterns formed by one or more candlesticks help traders identify potential reversals or continuations in price trends. However, candlesticks do not predict the magnitude of a move and should be viewed in the context of overall market structure and support and resistance levels.
Single‑Candle Patterns
Single‑candle formations are the building blocks of candlestick analysis. They capture a snapshot of the tug of war between buyers and sellers and can hint at potential reversals when they appear after extended moves. Common single‑candle patterns include:
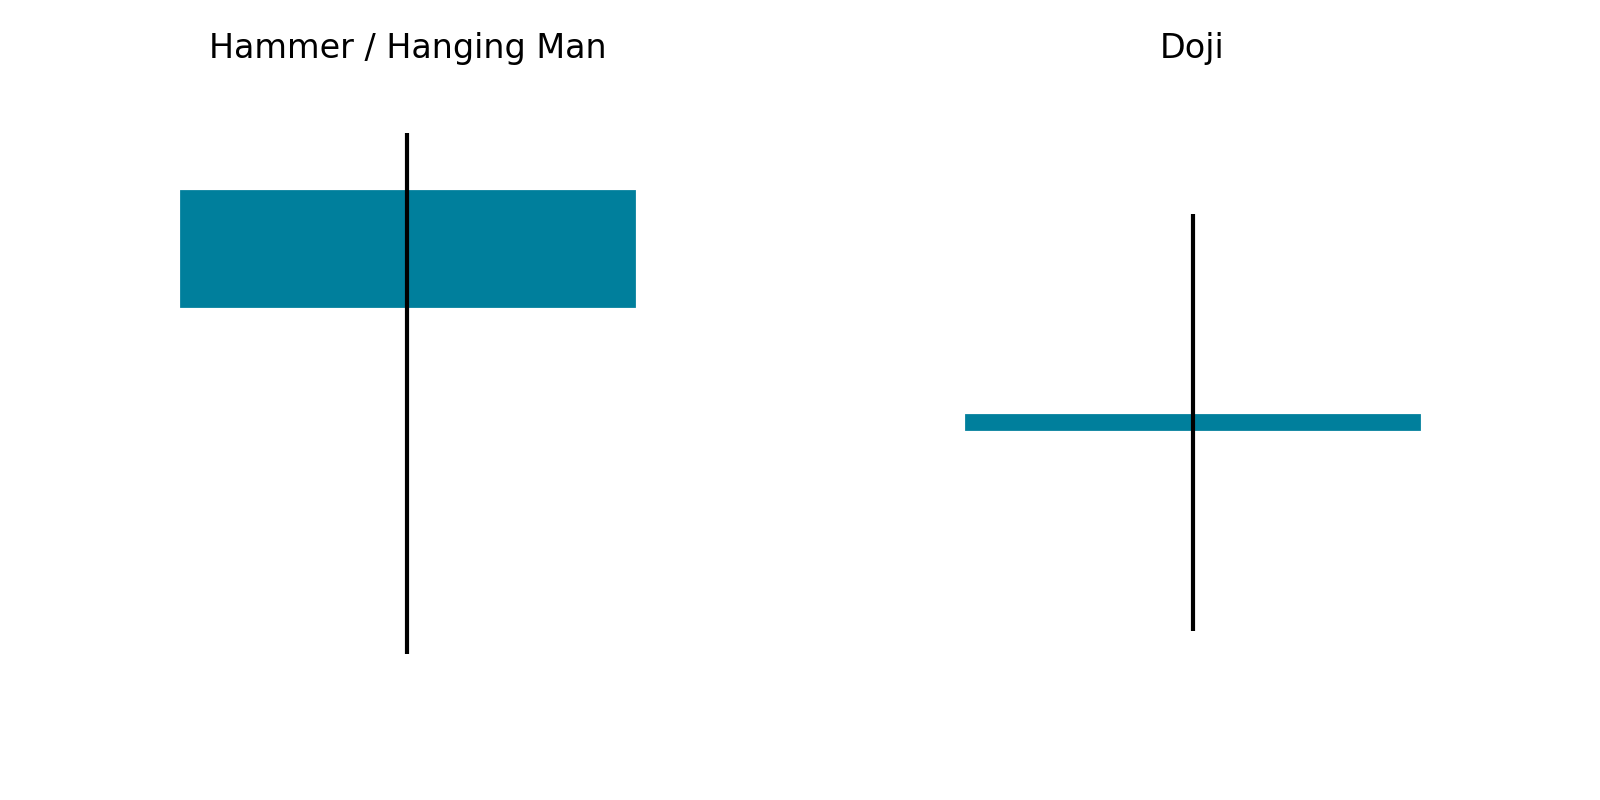
Hammer / Hanging Man
The hammer has a small body near the candle’s high and a long lower wick. It forms after a decline and suggests that sellers pushed price lower but buyers regained control, closing the candle near its open. The hanging man is its bearish twin; the shape is identical but it appears after an advance and warns that demand may be waning.
Doji
A doji occurs when the open and close are equal or nearly equal, leaving little to no body. It indicates indecision and often precedes a trend reversal or a period of consolidation. The length of the wicks provides clues about which side briefly gained the upper hand.
Shooting Star & Inverted Hammer
The shooting star is a bearish reversal candlestick with a small body near the low and a long upper wick; it shows that buyers drove price higher during the session but failed to sustain the gains. The inverted hammer has the same shape but appears after a decline and can signal a potential bullish reversal.
Marubozu & Spinning Top
A marubozu has no wicks—price opens at one extreme and closes at the other—reflecting relentless buying (bullish marubozu) or selling (bearish marubozu). A spinning top has a small body and long wicks on both sides, conveying market indecision; it often marks a pause in the prevailing trend.
Below is a sample illustration showing the hammer/hanging man and a doji. These simplified drawings are for educational purposes; real charts include many candles and should be analysed within broader price structures.
Double‑Candle Patterns
Patterns made up of two candles offer early warnings of trend changes. They compare the relationship between a candle and its predecessor to reveal shifts in momentum. Key double‑candle patterns include:
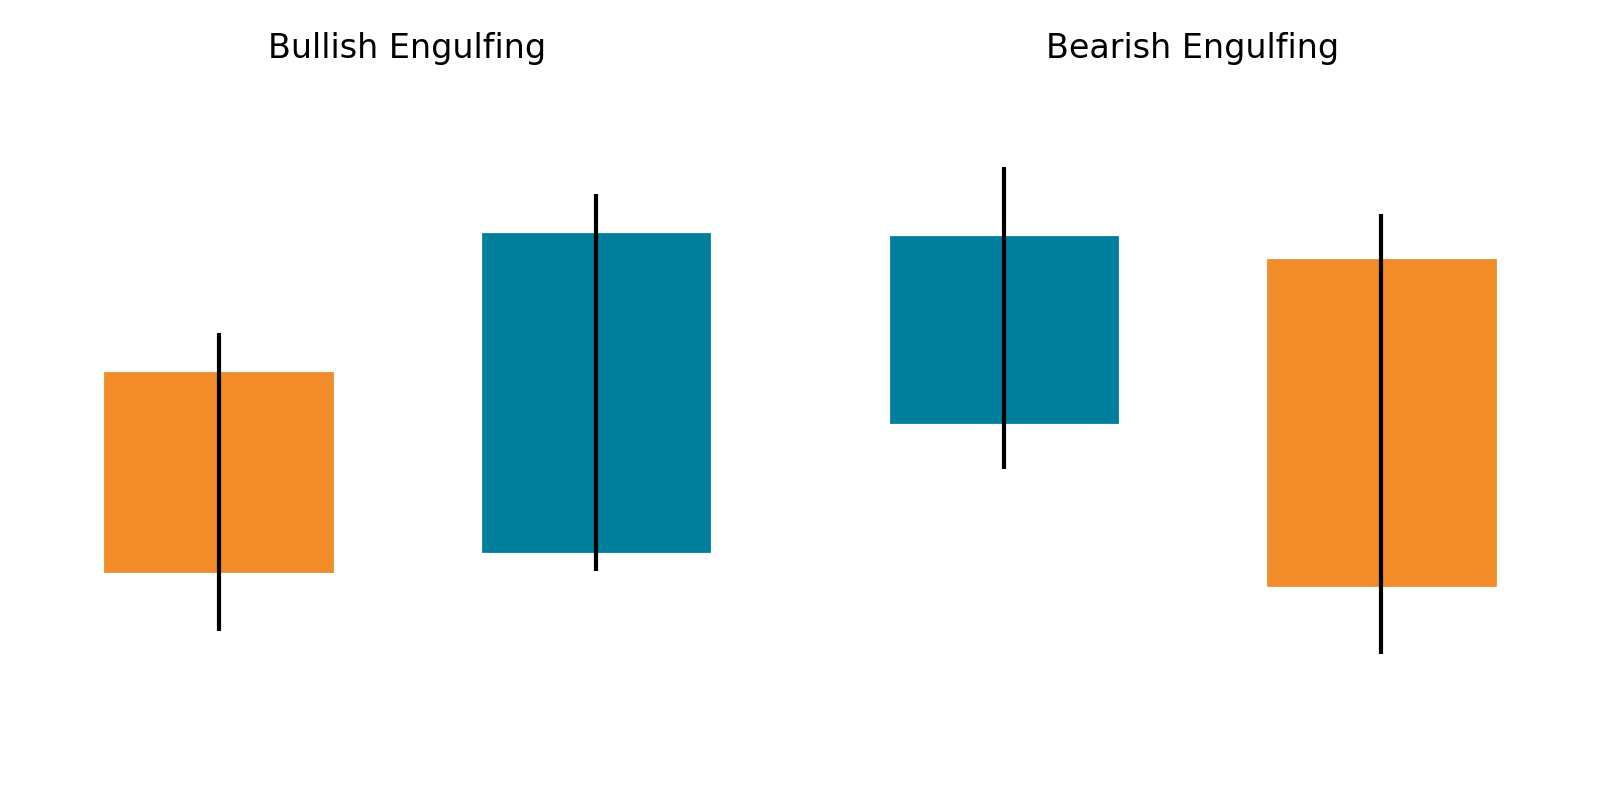
Engulfing
An engulfing pattern occurs when a small candlestick is followed by a larger candle of the opposite colour that completely engulfs its body. In a bullish engulfing pattern a small down candle is followed by a large up candle, signalling that buyers have overwhelmed sellers. In a bearish engulfing the roles are reversed: a small up candle is swallowed by a long down candle, warning of selling pressure.
Harami
The harami pattern features a large candle followed by a smaller candle contained within its body. A bullish harami appears after a decline when a small up candle occurs inside the previous down candle; a bearish harami occurs at the top of an uptrend. When the second candle is a doji, the pattern is called a Harami Cross and can mark major turning points.
Tweezer Tops & Bottoms
Tweezer patterns consist of two candles with matching highs (tweezer top) or matching lows (tweezer bottom). They signify that price reached the same extreme in two consecutive sessions and may reverse from that level.
The chart below illustrates bullish and bearish engulfing patterns. Notice how the second candle completely envelops the first, indicating a shift in control.
Triple‑Candle Patterns
Three‑candle formations combine a large candle, a small candle and a confirmation candle to capture complete trend reversals. Two of the most widely followed patterns are:
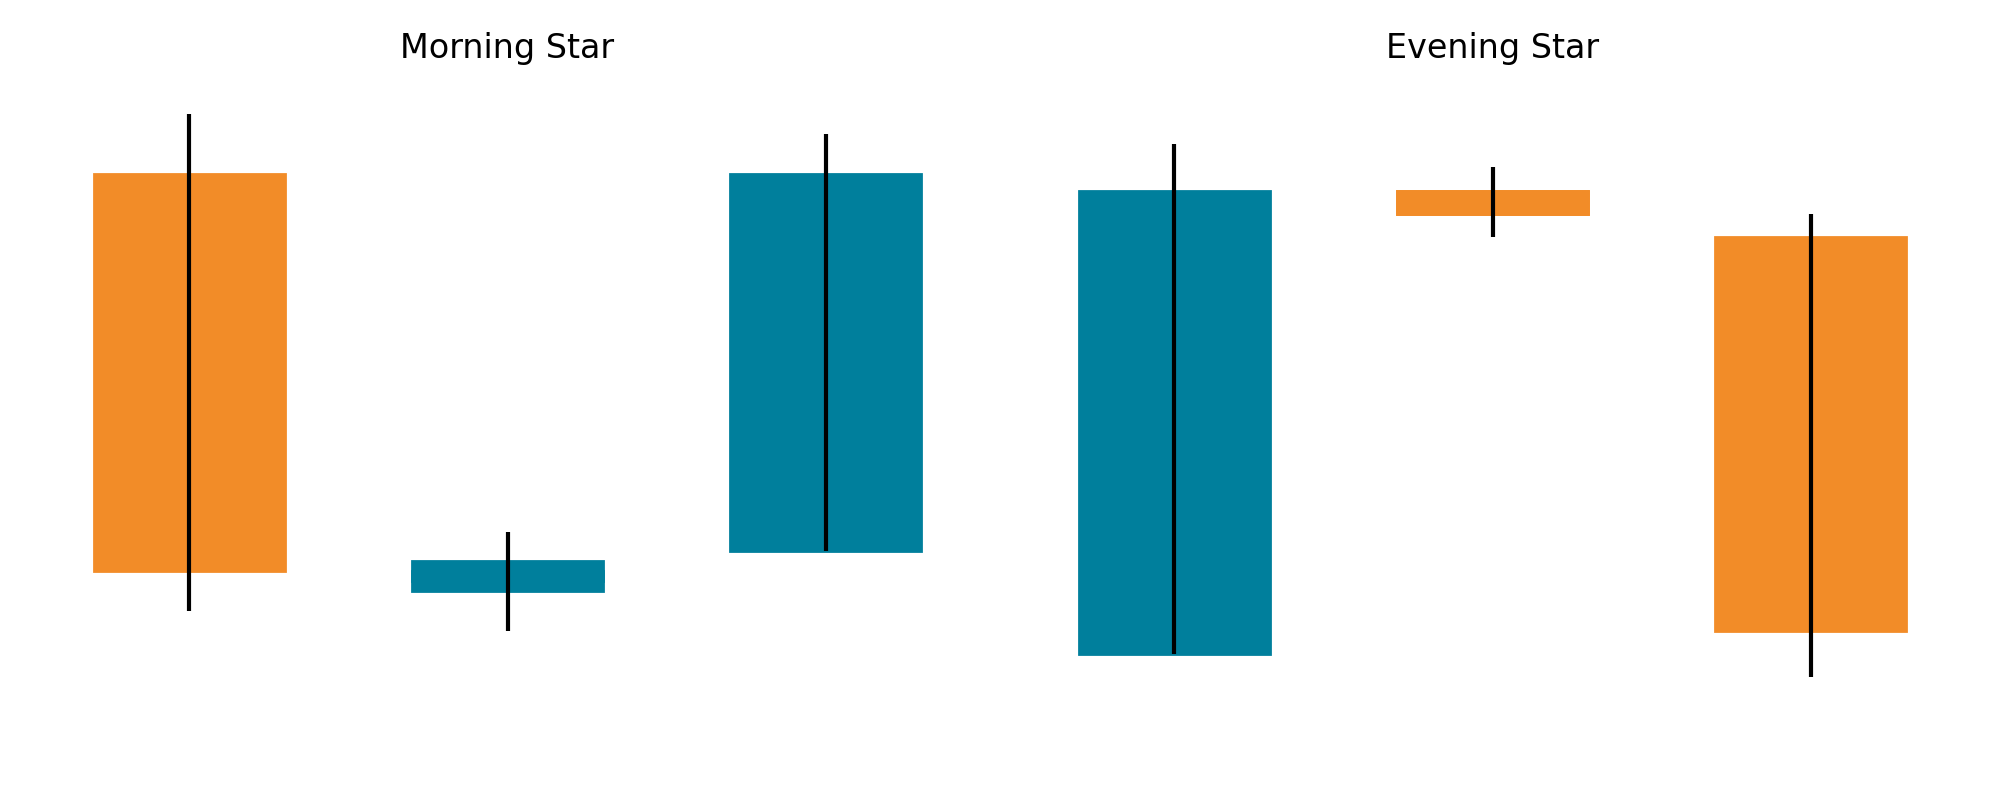
Morning Star & Evening Star
The morning star consists of a long down candle, a small-bodied candle that gaps lower, and a long up candle that closes above the midpoint of the first. It often marks the end of a downtrend and the start of a new upswing. The evening star is its bearish counterpart, appearing after a rally; it features a long up candle, a small candle (often a doji) that gaps higher, and a long down candle that closes below the midpoint of the first.
Three Soldiers & Three Crows
The three white soldiers pattern shows three consecutive strong bullish candles with higher closes and little overlap, signalling relentless buying pressure. Its bearish twin, the three black crows, consists of three long down candles with lower closes, indicating aggressive selling.
The diagram below depicts the morning star and evening star patterns. Notice how the middle candle is small and isolated, creating a pause before price reverses direction.
Limitations and Risk Management
Candlestick patterns are popular tools for interpreting price action, but they are not fool-proof. Patterns may not appear in all market conditions, can be interpreted subjectively and often provide false signals. Relying on them alone—without considering trend context, support and resistance levels or momentum indicators—can lead to losses. Candlesticks also reflect only historical price data and ignore fundamental events that can drive markets. For these reasons, traders should treat candlestick patterns as clues rather than forecasts and integrate them into a broader risk-management framework.
Candlesticks in a Risk‑First Trading System
At TradeBoTicks, we view candlestick patterns as part of the market narrative—not as signals to abandon discipline. Recognising a hammer, engulfing pattern or doji can help you anticipate potential reversals, but your trade size, stop‑loss and take‑profit levels must always be defined first. OptionTurtle’s risk‑first engine enforces position sizing and exit rules, ensuring that no single pattern or trade can jeopardise your capital. Use candlesticks to inform your analysis, but let risk management drive your decisions.